
View your Sales and Analytics
Using the TimeForge Manager Mobile app, retailers can view real-time Sales information from anywhere with just a few simple clicks. This guide provides an overview of the sales features and functionality available using the mobile app.
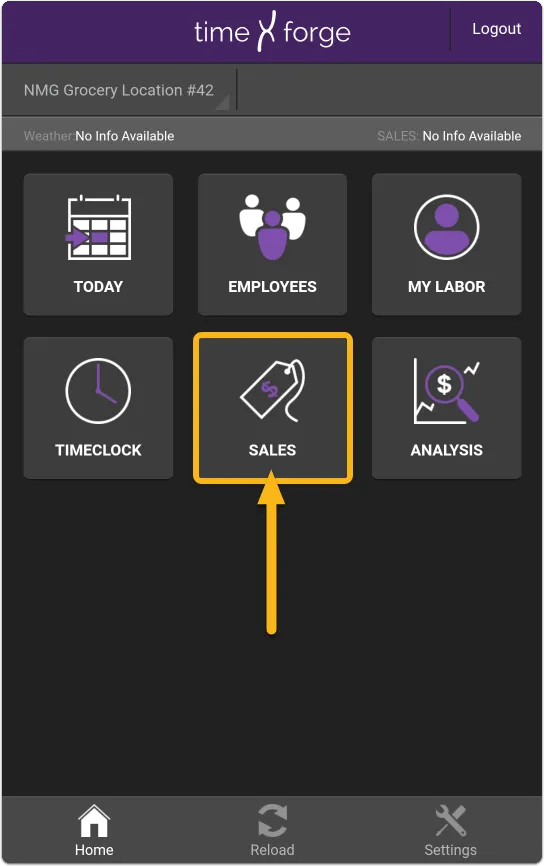
Open the Sales page in the app
Section titled “Open the Sales page in the app”Log into the mobile app on your smart phone, then tap the Sales tile.
View your Sales data
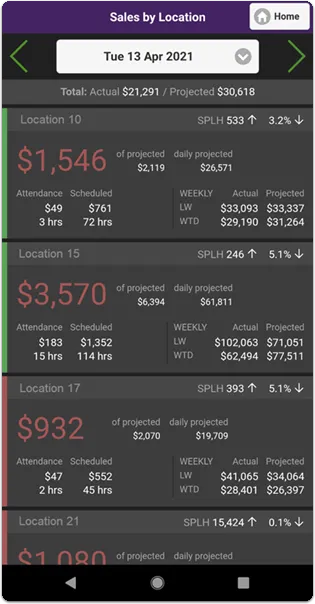
Section titled “View your Sales data”When you open the Sales page, the screen will display current sales totals by location by default. You can access additional screens by swiping left/right and by tapping a specific location to drill down into the details for that store.
Sales by Location
Also known as the Above-store Sales Dashboard, the sales by location screen provides information about multiple locations at once. This screen allows multi-unit operators to see information about all their stores at a glance.
Understanding the above-store sales dashboard
Section titled “Understanding the above-store sales dashboard”Below is a breakdown of the information shown for each location (in this example, the location is called Location 10):
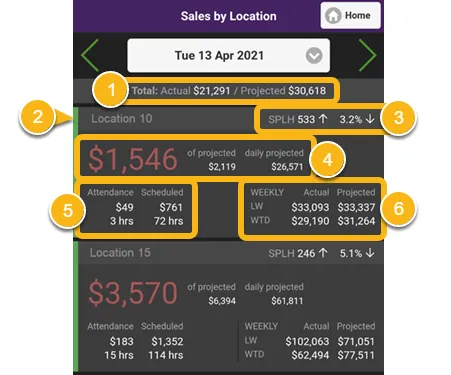
- Daily Actual Sales and Projected Sales totals across all locations listed
- Vertical red/green bar: green means actual sales are higher than same day last week, red indicates lower.
- Daily SPLH and labor percentage. Up/down arrow indicates increase/decrease over same day last week.
- Daily actual sales in red or green. Green means sales are higher than projected, red means lower. To the right, the projected sales are also listed.
- Daily Attendance costs/hours and daily Scheduled costs/hours.
- Weekly Actual and Projected totals, up to current day of the week. LW = Last Week; WTD = Week to Date.
For comparison purposes, when viewing data for the current day, all values are as of the current hour, including projections!
Sales by Department
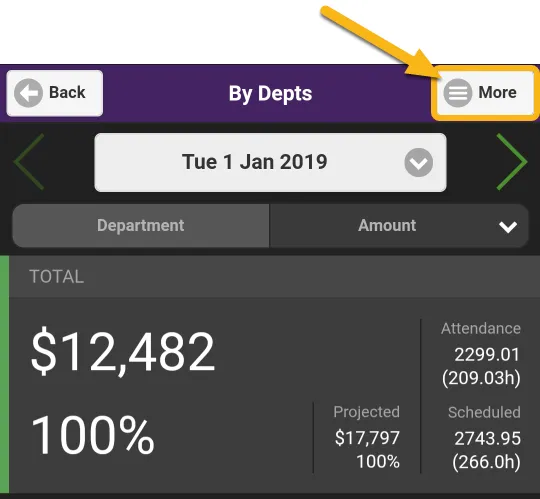
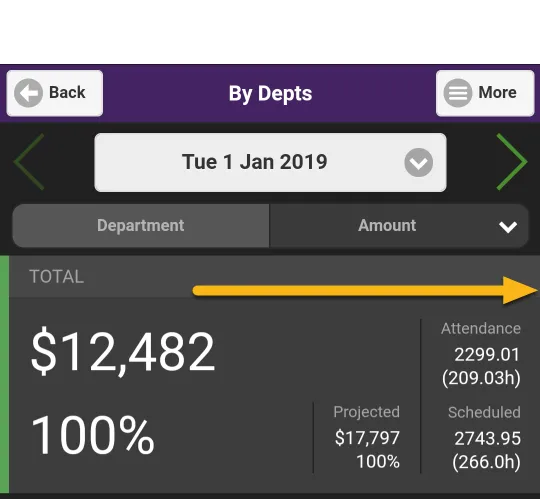
When you drill down into a location, you can view additional screens with details specific to that location by swiping to the left. Sales by department is one of several ways you can view a breakdown of your sales.
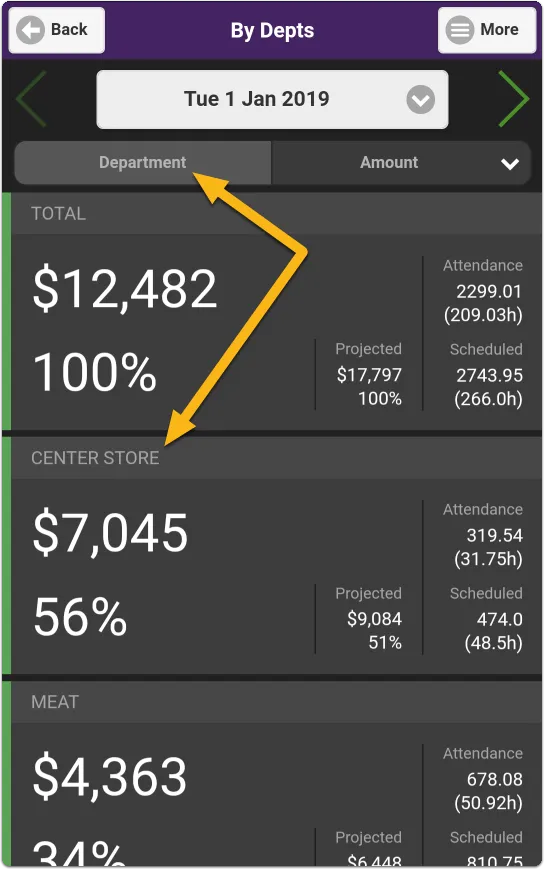
While on the Sales by Department screen, you can easily switch between sorting by Department and by Amount using the buttons just below the date.
Attendance and Scheduled Hours
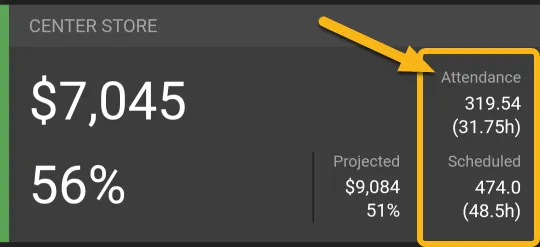
Section titled “Attendance and Scheduled Hours”On the right side of each entry, you’ll see your total Attendance and actual labor costs. Under that will be your Scheduled labor and expected labor costs for comparison.
Manager Projections
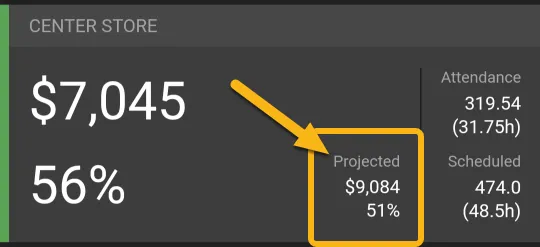
Section titled “Manager Projections”If you use Manager Projections, you will also see your projected sales.
Ahead or behind the previous day?
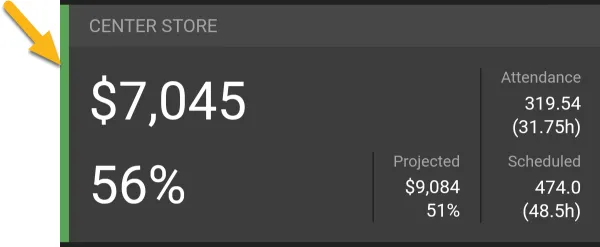
Section titled “Ahead or behind the previous day?”Finally, each entry has a red or green bar to the left of it, which indicates whether the figures are ahead or behind the previous week in terms of sales. In the example below, the green bar indicates that the CENTER STORE department is ahead of the previous week’s sales.
Select a different location or date (filter your results)
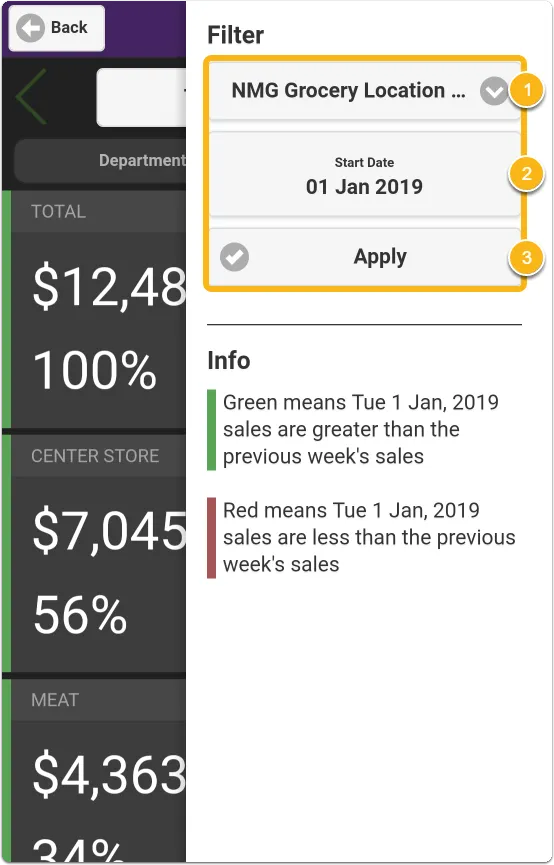
Section titled “Select a different location or date (filter your results)”If you would like to view the sales data for a different location or different date, tap the More button in the upper right. You will be presented with a list of filters and information.
- Select the location
- Select the date
- Tap Apply
View your Sales by Hour
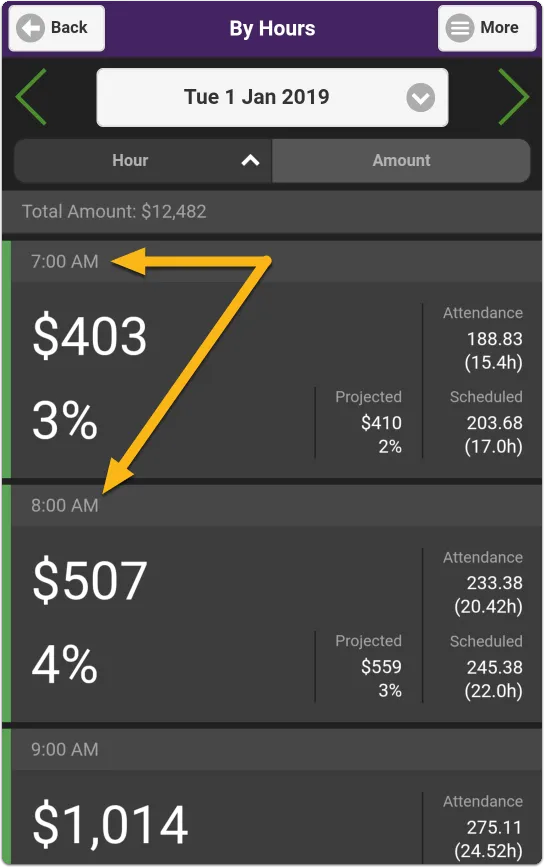
Section titled “View your Sales by Hour”By default, drilling down to a location shows you your sales by department, but you can also see sales broken down by hour.
To view your sales by hour, simply swipe to the left on your screen.
The page will look almost identical, except entries will be by hour instead of department, and there will be an extra line above the list with the Total Amount of sales for the day.
Sales Analysis Graphs
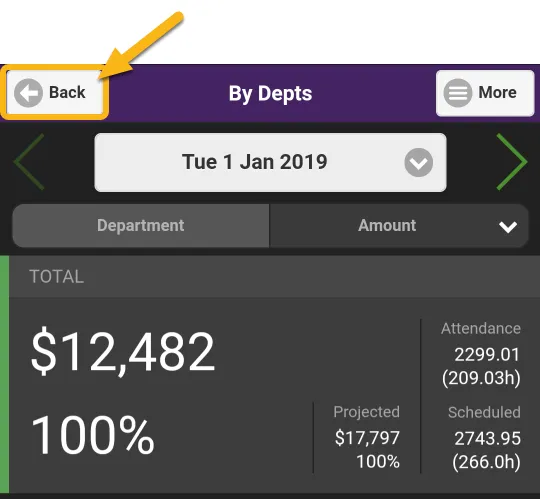
Section titled “Sales Analysis Graphs”To view graphs of your sales, you’ll first want to return to the home screen on the app. Just tap the Back button in the upper left.
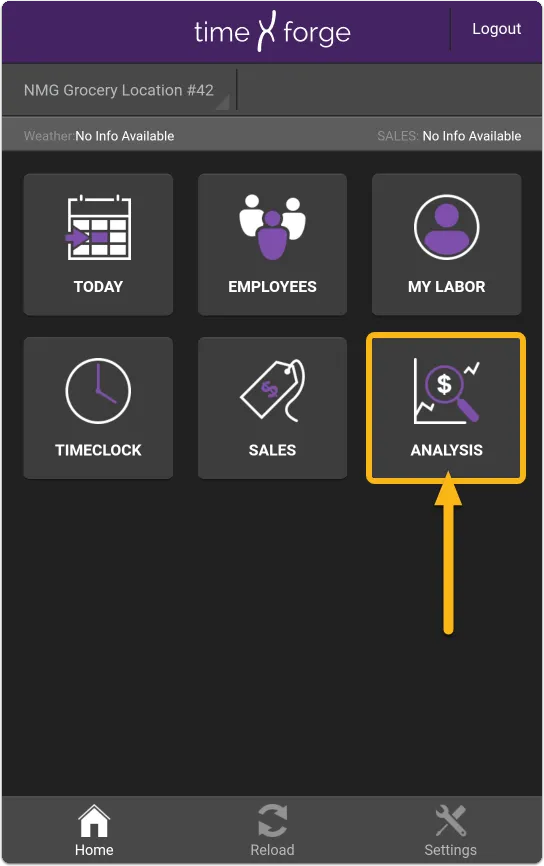
Then, select the Analysis tile.
Sales Data
Section titled “Sales Data”When you tap the Analysis tile, you’ll be shown a graph of your Sales Data. By default, all departments will be shown, and data will be shown for the current week.
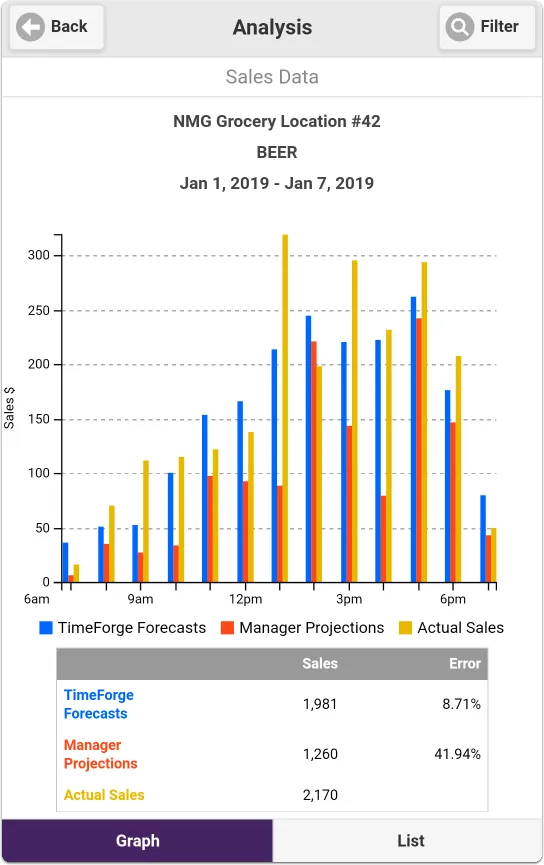
The blue bar shows forecasted sales, the yellow bar shows actual sales, and if you input any manager projections, there will be a red bar showing projected sales. A summary and key is available below the graph to make things easy.
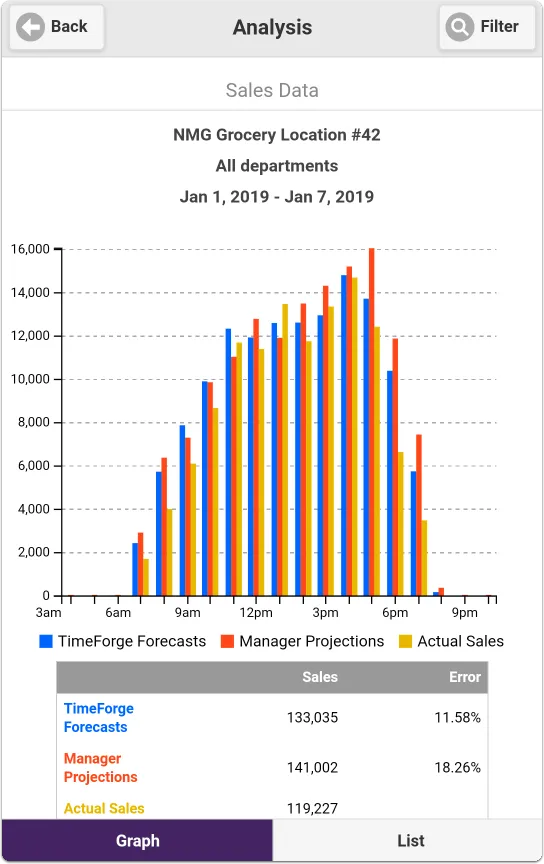
The buttons at the bottom of the screen allow you swap between Graph and List view. List view simply shows the data in a list format similar to what we saw in the sections above.
Filter by location, department, or dates
Section titled “Filter by location, department, or dates”Similar to the Sales page, you can select the Filters button in the upper right-hand corner to view and change the filters applied to the graph.
In this example, we’ve selected the NMG Grocery Location #42, All departments, for the week of January 1-7 2019.
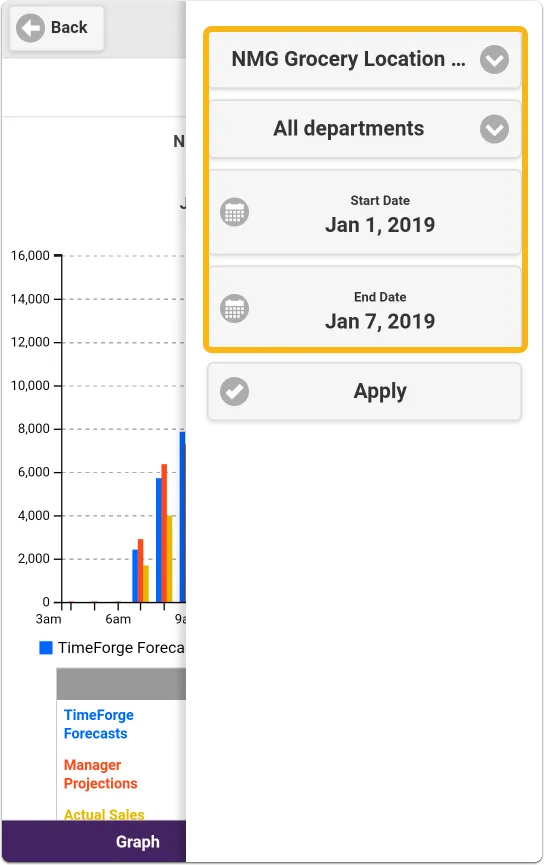
If we selected BEER as the department and tapped Apply, we would see:
Labor Distribution Graph
Section titled “Labor Distribution Graph”You can view additional graphs, such as Labor Distribution, by swiping left.
The Labor Distribution graph will show you real time labor costs. Here we see actual sales (represented by a yellow line) compared to our actual (green line) and scheduled (red line) labor costs.
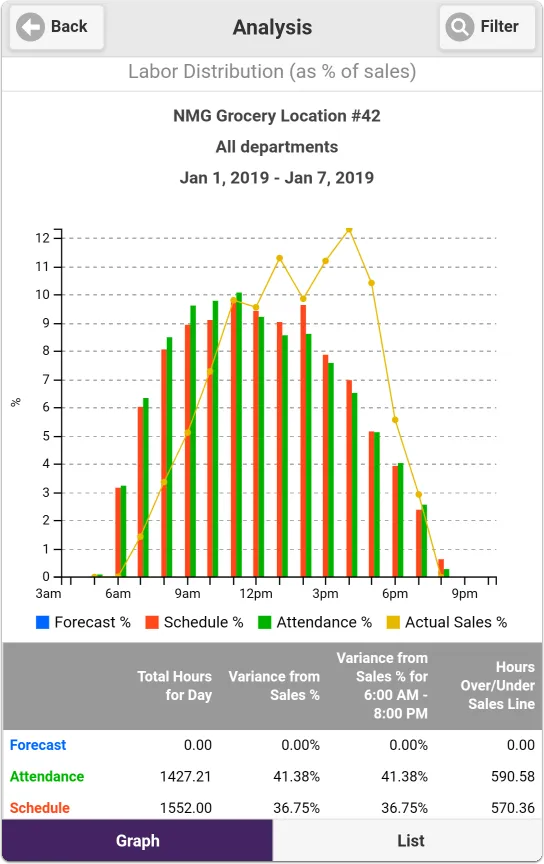
This graph is purely percentage based, and is comparing your schedule, attendance, and TF Labor Forecast (where applicable) to your sales trends. This is most useful when limited down to departments like Front End, where we should (usually) only have labor where our sales are.
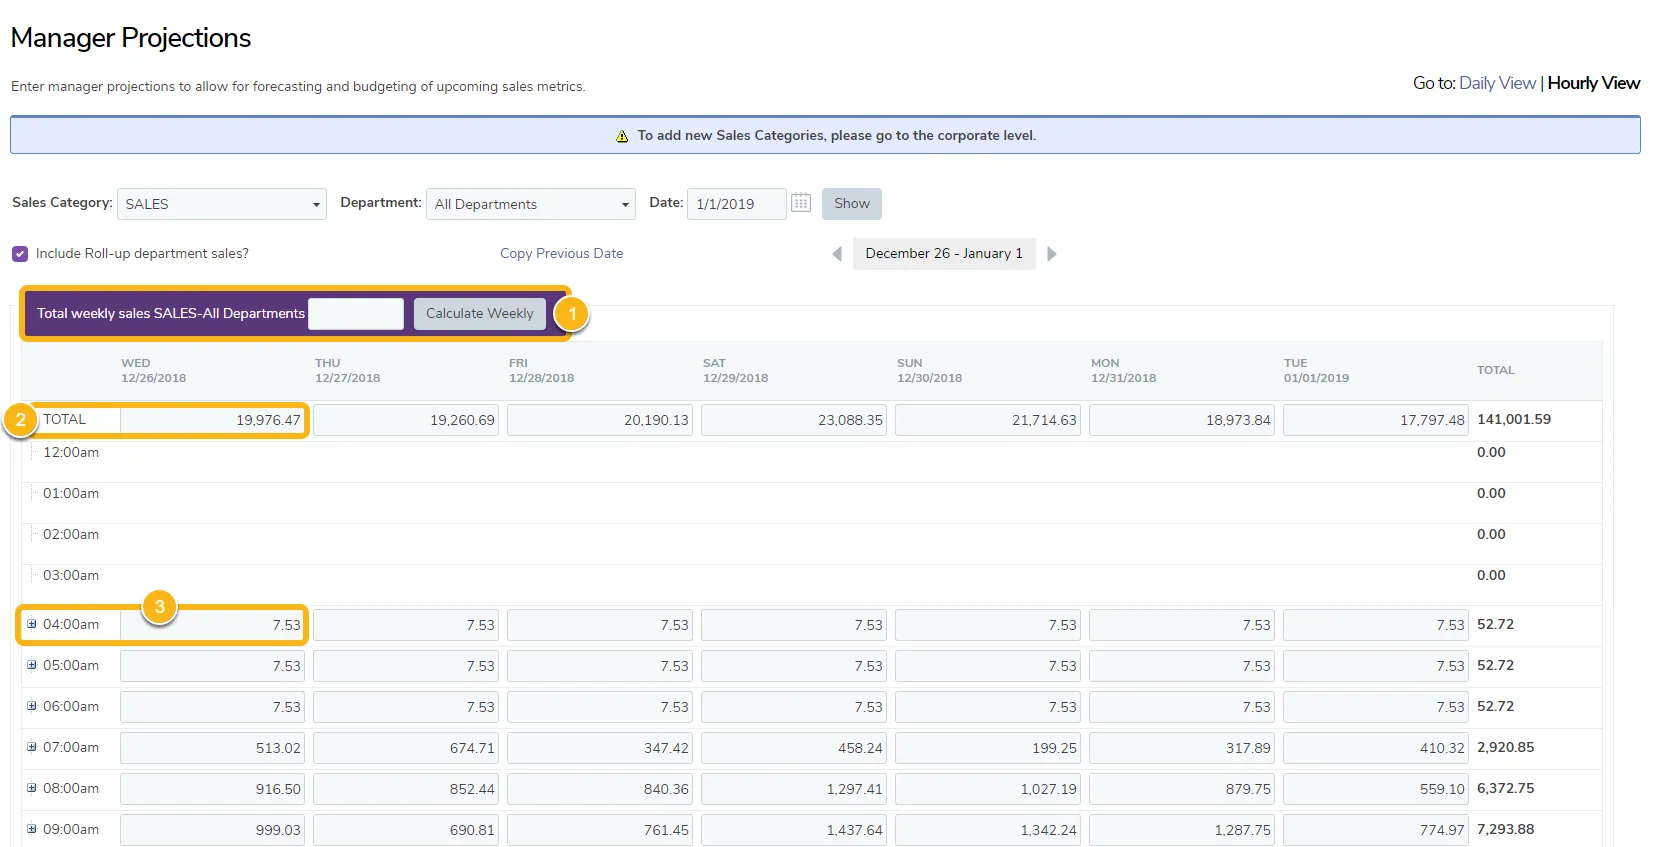
How to enter manager projections
Section titled “How to enter manager projections”All manager projections must be entered using the online version of TimeForge. To get to the appropriate screen, open the Sales tab and select Manager Projections.
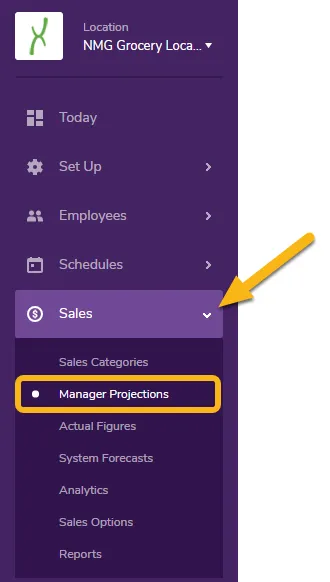
This screen is where you enter your projected sales. There are several ways to do this:
- The simplest way is to input projected sales for the entire week and select Calculate Weekly. TimeForge will distribute the total based on the previous week’s sales trends.
- The second way is to enter a daily projected sales total into the TOTAL column for each day. TimeForge will distribute the amount by daily sales trends for that particular day.
- You can also enter projections by hour or in even smaller (quarter-hour) increments!