Configure your sales categories
Sales categories are key performance indicators (KPIs), or ways to evaluate the success of your company. Sales categories can be used for things like making an employee schedule, monitoring the labor costs of salaried employees, and even projecting your gross sales. TimeForge offers a very customizable “Sales” feature that helps you stay on top of your business’s metrics. If you’re integrated with a POS system, we’ll likely pull these sales categories from that system. However, if you need any assistance setting up sales categories, please don’t hesitate to contact us.
After configuring your “Sales Categories,” you’ll likely want to consider setting up ShiftBuilder rules so that you can start generating schedules with the ShiftBuilder based on your Sales Projections.
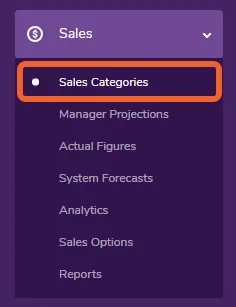
At the Location level, open the Sales tab and select Sales Categories.
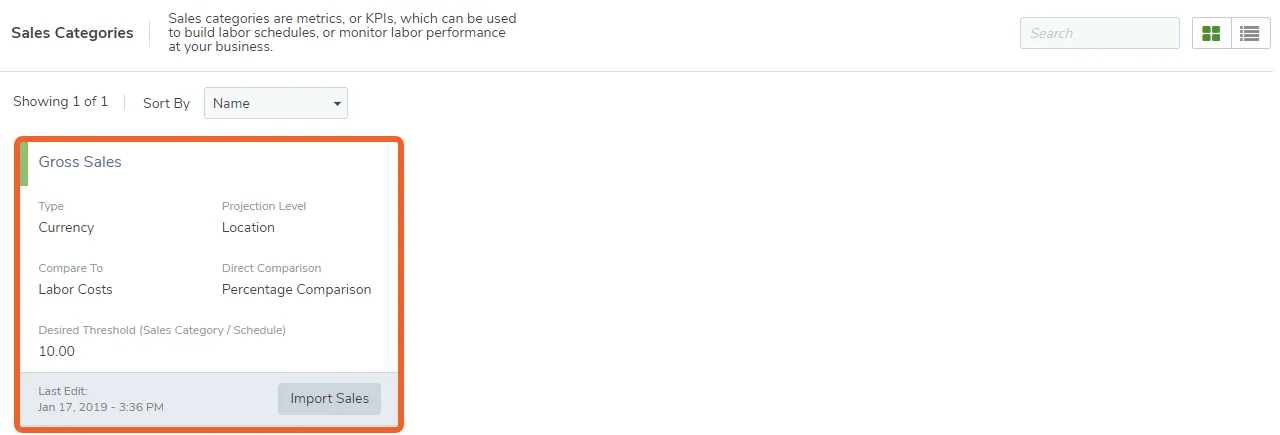
Select the category you would like to configure.
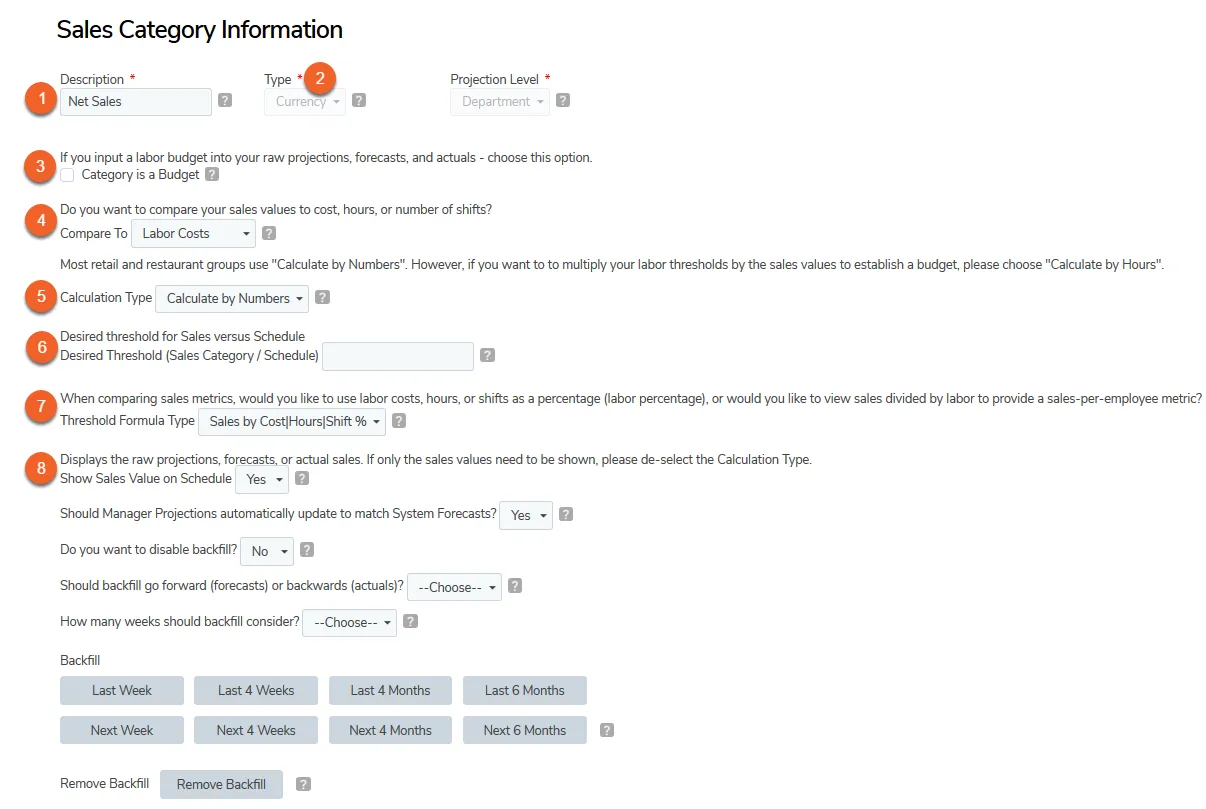
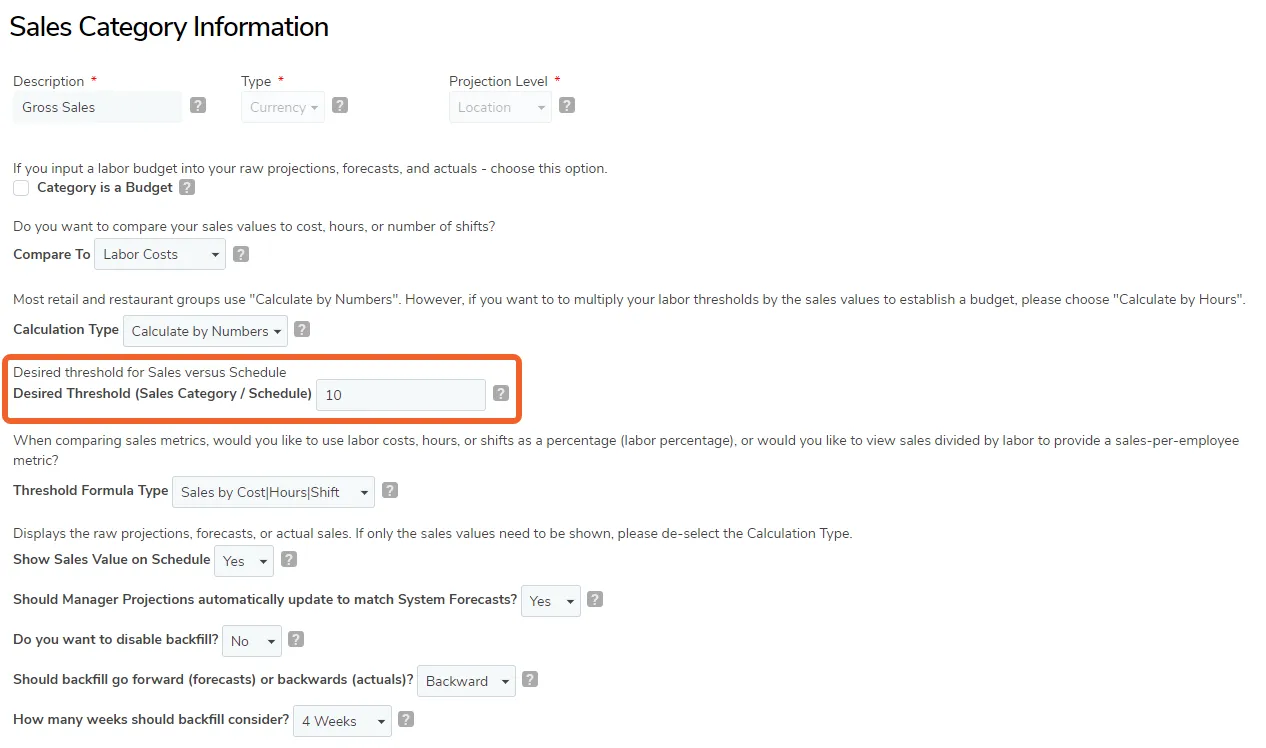
- Description: The Sales Category Description is simply the name of the Sales Category. This was determined when the Sales Category was created.
- Type: The Type was also configured when the Category was added. Currency is the most usual choice, which is for numeric values such as Gross Sales, Net Sales, or Tips. However, “Inventory” should be used if you’re tracking items sold. If you’re tracking Customer Count, use “Other.”
- Category as a budget: How do you want Sales to be Compared to Labor? If this should be based on a target threshold (like 13%), do not check this box. If sales should be directly compared to labor, do check this box.
- Compare To: Most customers want to compare their sales to their labor costs (a dollar-to-dollar comparison). However, we also support comparing sales to labor hours (Sales Per Man-Hour), or comparing sales to scheduled shifts.
- Calculation Type: Most customers want to calculate by “Numbers”, but we enable calculation by “Hours” if you need it. You should calculate by “Numbers” if you want your Desired Threshold to be the “magic number” that your schedules need to meet. That is, if your scheduled cost (or hours, or shifts, depending on item 4) need to be under 13%, then “Numbers” is for you. However, you should calculate by “Hours” if you want to enter a productivity budget that is calculated by multiplying your sales with your Desired Threshold. In other words, if your schedules need to be under $300 (or under 300 hours, or under 300 shifts, depending on what you selected in item 4), then “Hours” is for you.
- Desired Threshold: If you do not want a category as a budget (item 3), and you are not using department-level or position-level thresholds, enter a “Desired Threshold” like thirteen percent (type in 13) - or whatever is appropriate for your business based your KPIs.
- Threshold Formula Type: Cost|Hours|Shift by Sales % is the default formula, and most restaurants will use this default formula. It’s for comparing whatever was selected in item 4 - the labor cost, labor hours, or number of shifts - to the sales, and displaying that as a percentage. Cost|Hours|Shift by Sales is for comparing whatever was selected in item 4 - the labor cost, labor hours, or number of shifts - to the sales, and displaying that as a decimal. Sales by Cost|Hours|Shift can be used for SPMH (Sales Per Man-Hour), and most retailers will use this formula. It is for comparing sales to whatever was selected in 4 - labor hours for SPMH - and displaying that as a decimal. Similarly, Sales by Cost|Hours|Shift % is for comparing sales to whatever was selected in 4 - labor hours for SPMH - and displaying that as a percentage.
- Show Sales Value on Schedule: If you want to display the sales value (like $1,500) on your Schedule, select Yes. If you want to display the Sales-to-Labor % on your Schedule, select No.
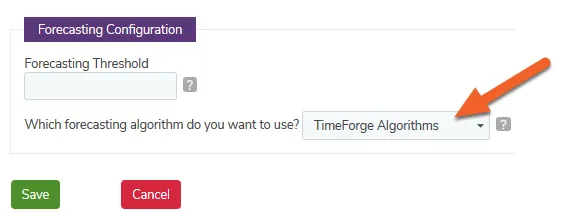
Under the Forecasting Configuration section, you can choose a forecasting threshold and select which forecasting algorithms to use. The TimeForge Algorithms are the default and recommended.
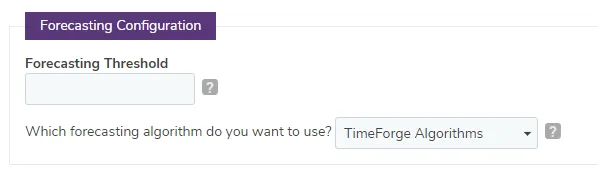
TimeForge Algorithm: This determines whether you’d like to use the default TimeForge Algorithms that our Sales Forecaster runs. Because of their accuracy, the default TimeForge algorithms are used most often and usually recommended.
You can input your own information and and create a forecast based on weighted averages. Usually, you’ll have very specific numbers and be looking for a specific date/day of the week to forecast.
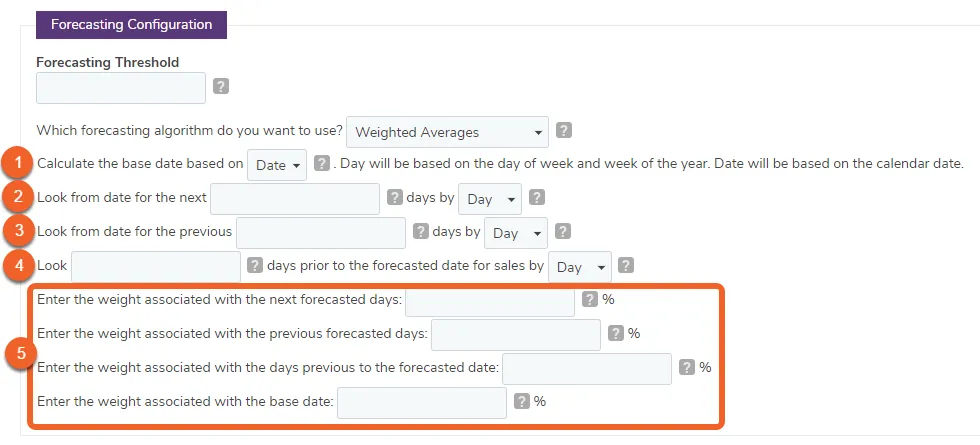
- This option determines whether you are interested in calculated the date for this forecast as either a date (the 1st) or a day(Friday).
- Choose how many days in the future that TimeForge should look at to make a forecast. This number can either be in days or weeks.
- Choose how many days in the past that TimeForge should look at to make a forecast. This number can either be in days or weeks.
- You can determine a set number of days or weeks in the past that TimeForge should look at to make a forecast.
- These options determine how heavily each average is weighted. So, if you want “the previous foretasted days” to be weighted more than the others, simply type in a higher number in the corresponding box. These four numbers must equal 100%.
Forecasting your sales using a Weighted Average Variance is similar to calculating with Weighted Averages, except this formula actually lets you eliminate random outliers from being included in the calculations.
See our step-by-step guide on forecasting your sales with this method.
Forecast your sales
The TimeForge Sales feature is a powerful and easy-to-use analytics tool that can help you keep track of manager projections, actual sales numbers, and forecast sales using system generated projections that are based on your sales history. Sales numbers can be referenced and viewed on employee schedules, and analyzed using the Sales Analytics tool - a simple solution to ensure that complex schedule forecasts are kept in check.
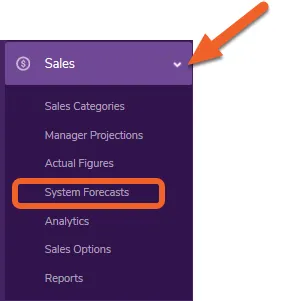
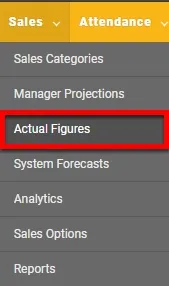
Open the Sales tab and select System Forecasts from the menu.
You can choose any sales category and any date to forecast sales. A Sales Category can include:
- Gross Sales
- Net Sales
- Customer counts, plates, or covers
- Inventory Items, such as khaki pants sold, steaks to prepare, lobster sales, or booked hotel rooms
- Any other number that makes sense for your business!
Click Show to forecast your sales.

TimeForge will forecast sales for you based on your previous business. You can see daily totals, daily totals broken down by hour or 15 minute increments, or a weekly forecast.
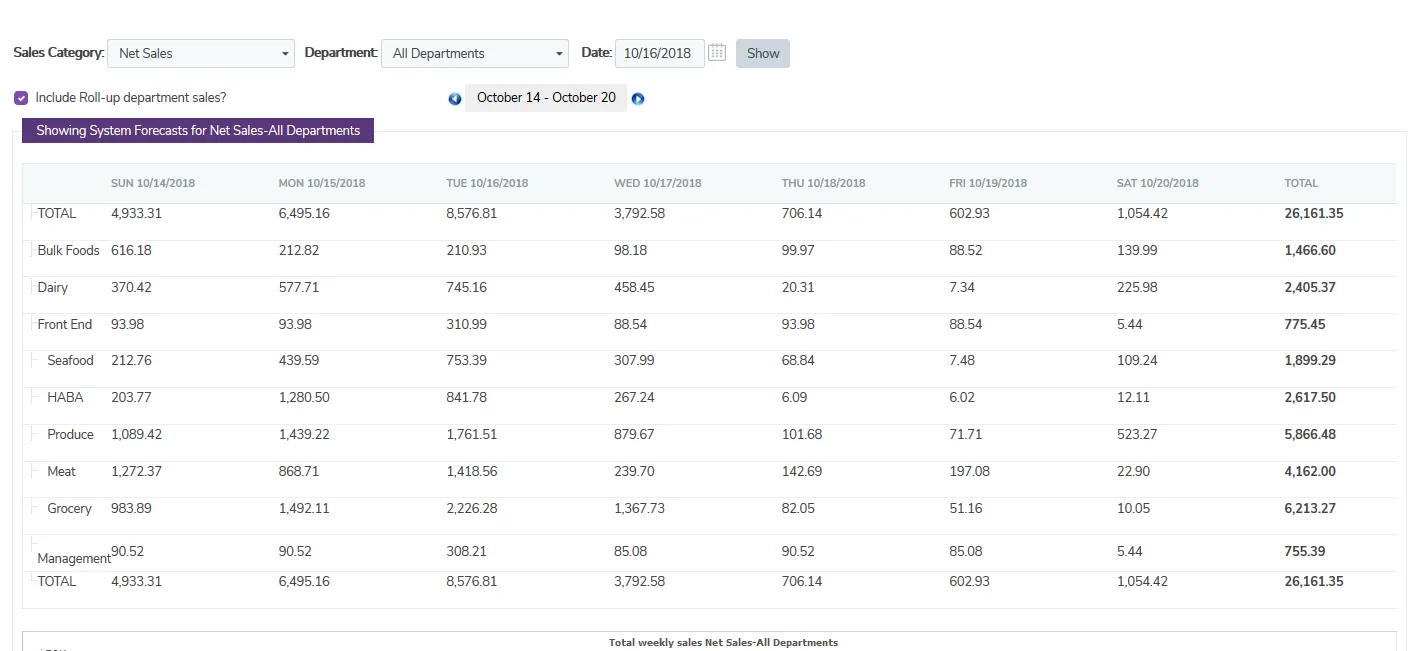
Project your sales for the week
Using the TimeForge Sales feature, employee schedules can be compared to Manager Projections, Actual Numbers, and System Generated Forecasts. After creating the necessary Sales Category, numeric values should be entered into the Manager Projections area. Once the week (or day) is over, Actual Values from the Point of Sale system, Cash Register, Property Management System, or other revenue control system can be entered into the “Actual Values” area of the software.
You can project sales quickly and easily, just follow these steps.
Open up the Sales tab and select Manager Projections from the menu.
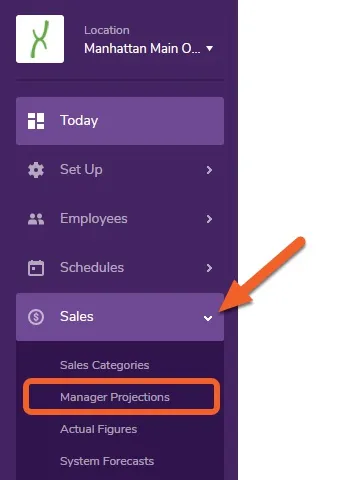
Manager Projections can be used to forecast sales for the week (or day). Manager Projections are typically the “gut feeling,” or estimates that you or managers create to project certain Sales Categories. Projections can be entered by hour or quarter-hour, and daily and weekly summations are easily viewable.
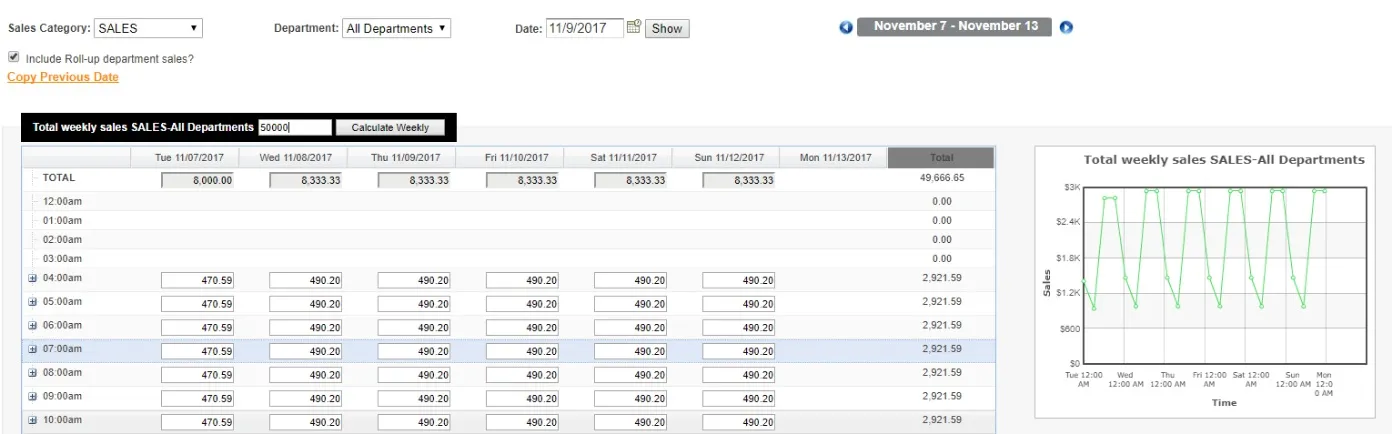
You can also copy a previous weeks projections by using the copy previous date link on the top left, as indicated below. Note that our Sales Category for this example is Gross Sales.
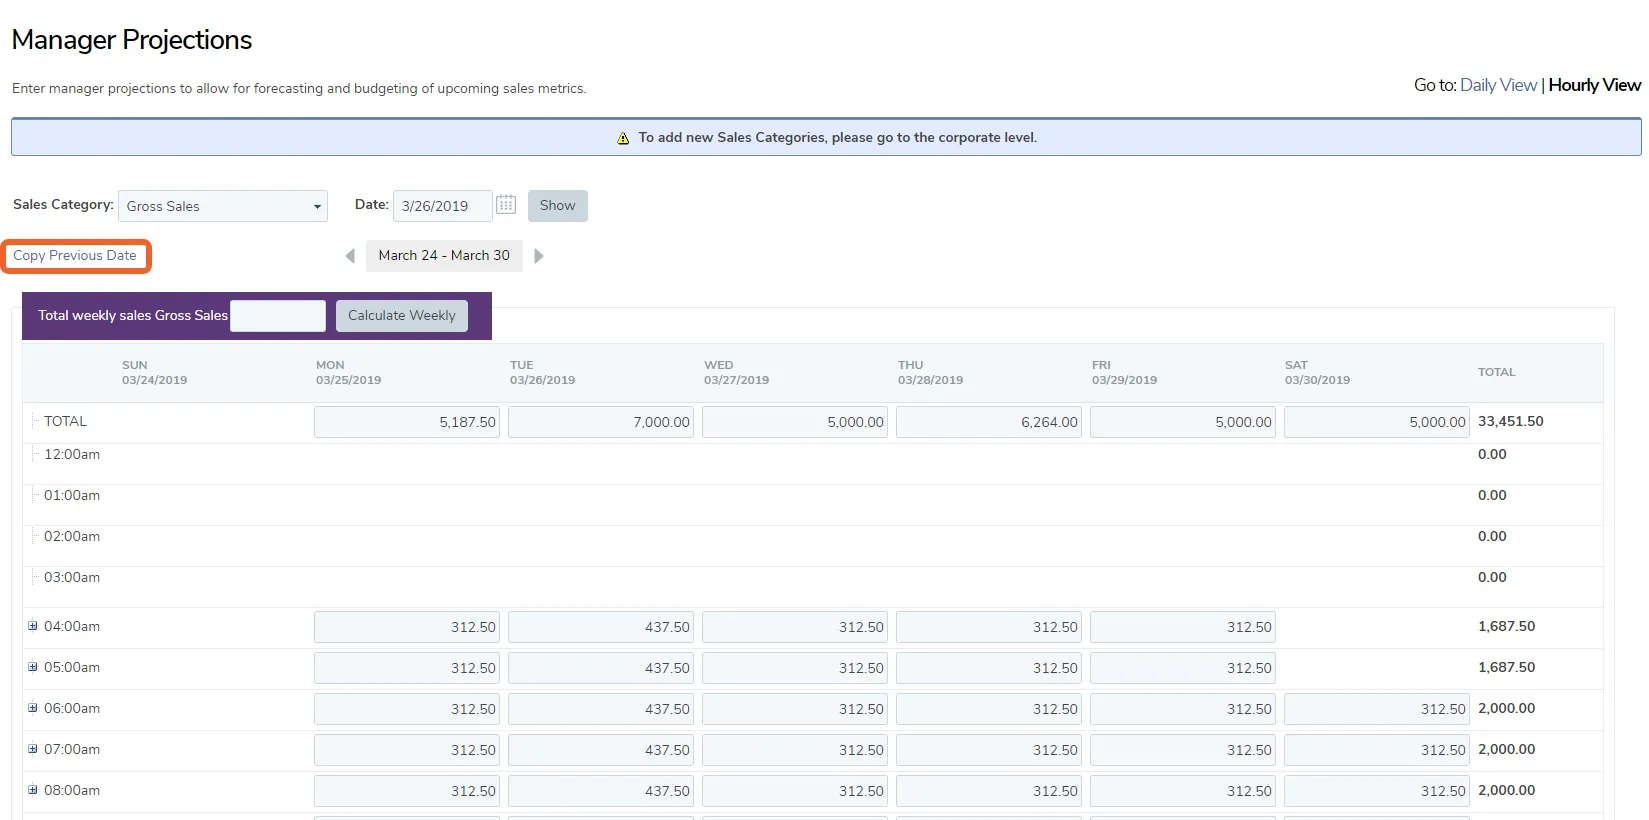
In the image above, there are no sales fields for 12am, 1am, 2am, or 3am because the “open” hours for this particular location are set to 4am to 8pm. The hours shown will always be dependent on any open / close hours that are currently defined for your location.
Enter or update your projections by the hour or quarter-hour. To enter quarter-hour projections, simply click the + plus sign next to a particular hour to expand it.
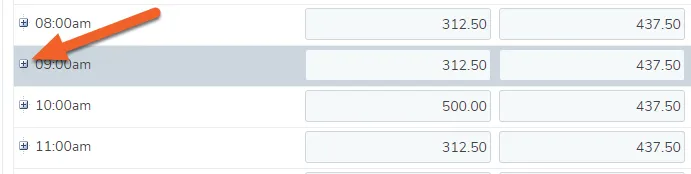
Any changes you make will be immediately saved, and changes to individual values will immediately update the totals per column.

At the bottom of the page, you can see a graphical representation of your total weekly sales based on the Sales Category you chose.

If you are the owner of your business’ TimeForge account or have the correct permissions, a number of settings are available to you under Sales Options, including:
- Allowing Supervisors to access the Sales module in TimeForge
- Viewing Manager Projections and System Forecasts on the labor schedule
- Enforcing the labor ratios, which will disable the posting of schedules unless they meet the necessary labor ratio percentages
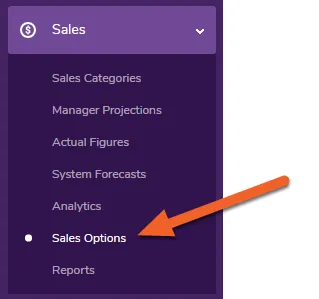
To configure these settings, select the Sales Options page from the left side menu.
Make your selections based on how your business works and how you’d like TimeForge to work for you.
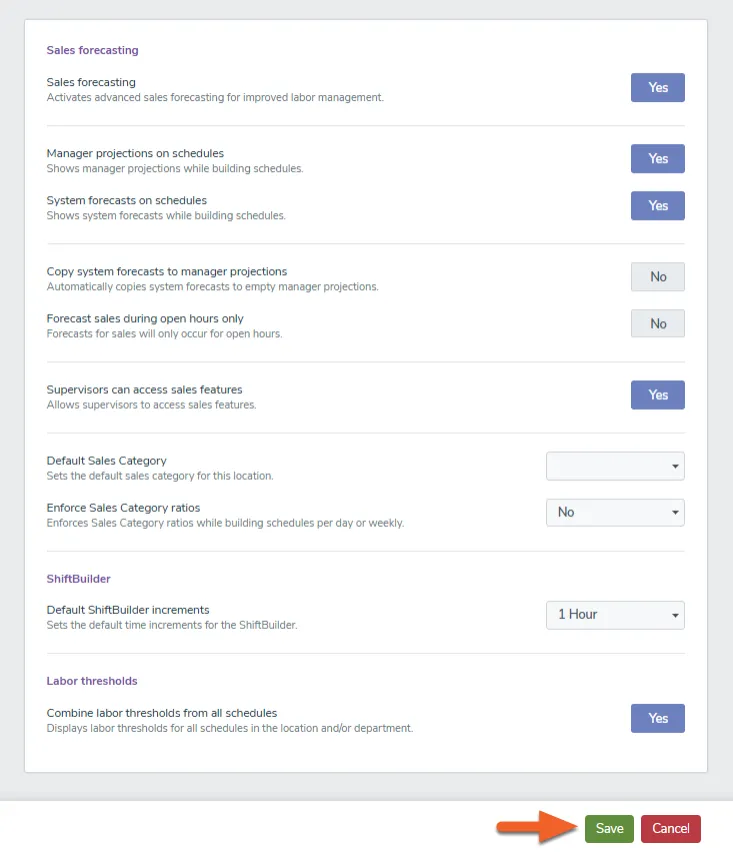
Don’t forget to click Save if you make any changes to your Sales Options.
Use Sales Analytics to analyze your labor costs
TimeForge Sales includes a powerful Sales Analytics tool, designed to easily visualize the differences in labor costs, a manager’s sales categories (such as gross labor, customer covers, customer counts, or inventory items), and other relevant numerical information. Watching for trends in the numbers will allow management to be proactive in creating business decisions.
There are two ways to access the Sales Analytics tool in TimeForge. Either through the employee schedule page, or through the “Sales Analytics” page.
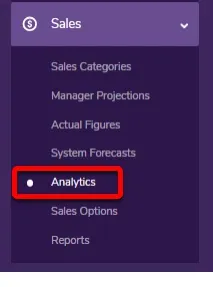
- Log in
- Hover over the “Sales” tab
- Click “Analytics”
Note: If you know which schedule you would like to analyze, you can use the following step.

Employee schedules can be analyzed and compared to Manager Projections, Actual Values, or System Generated Forecasts.
This is the other way to access the Sales Analytics tool, which is reached by using the list of schedules, and clicking on “Analyze.”
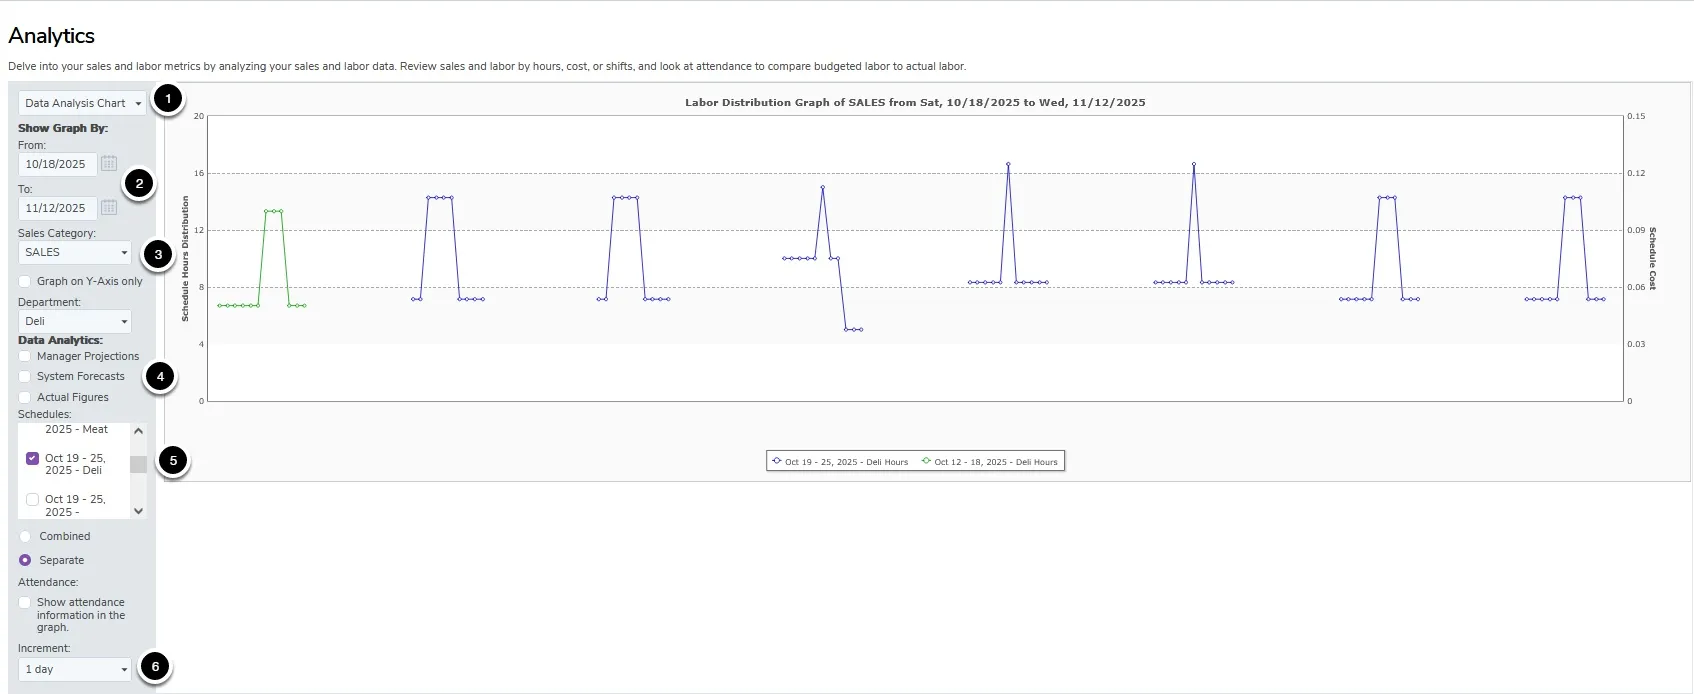
Follow the instructions on the Sales Analytics page, choose the desired Sales Category, and any other applicable options from the left-hand column.
1. Choose which type of chart to display. You can select either Data Analysis, Staffing Sales, Staffing Cost, or Threshold.
2. Input the start and end time that the chart should display.
3. Select the sales category you want to appear on the chart.
4. Decide if you want manager projections on the chart.
5. Select which schedules need to be included on the chart.
6. Choose how the graph is broken down, either by day, or all the way down to 15 minute increments.
The software will build a visual chart, allowing you to graphically compare Manager Projections, System Generated Forecasts, and the Actual numbers against employee work schedules.
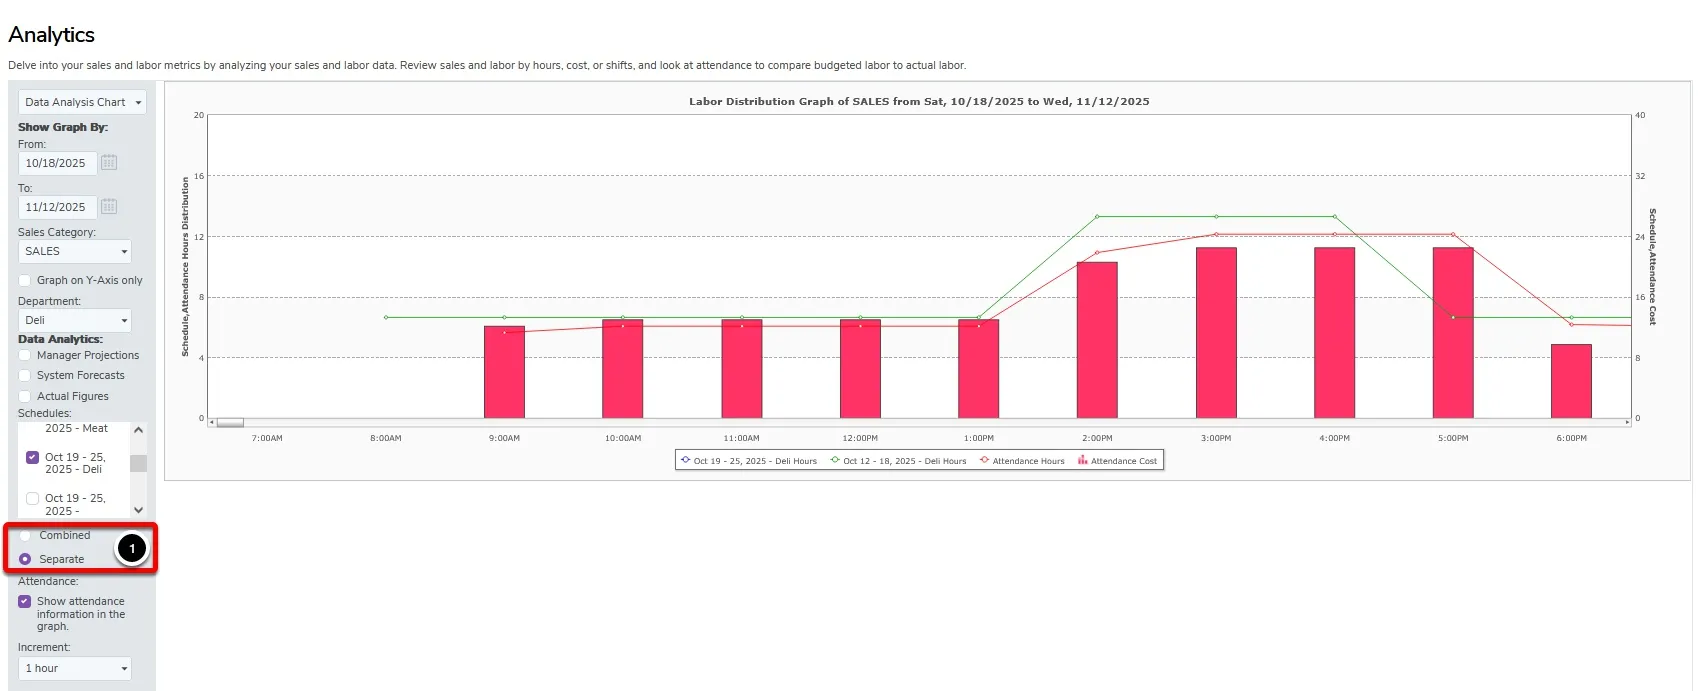
The above graph is a sample employee schedule from 10:00am - 5:00pm, and the Sales Analytics tool is displaying the cost of labor (in purple), as well as the Manager Projection (in blue) for the same time period. Employee schedules can be combined, or graphed separately, based on your requirements (1).
Note: The labor costs purple line stay flat, while the blue Sales Type line (Gross Sales in this case) goes up and down. This may indicate that some staff should be sent home when the blue line goes down sharply, and staff members should be brought in when the line goes up sharply.
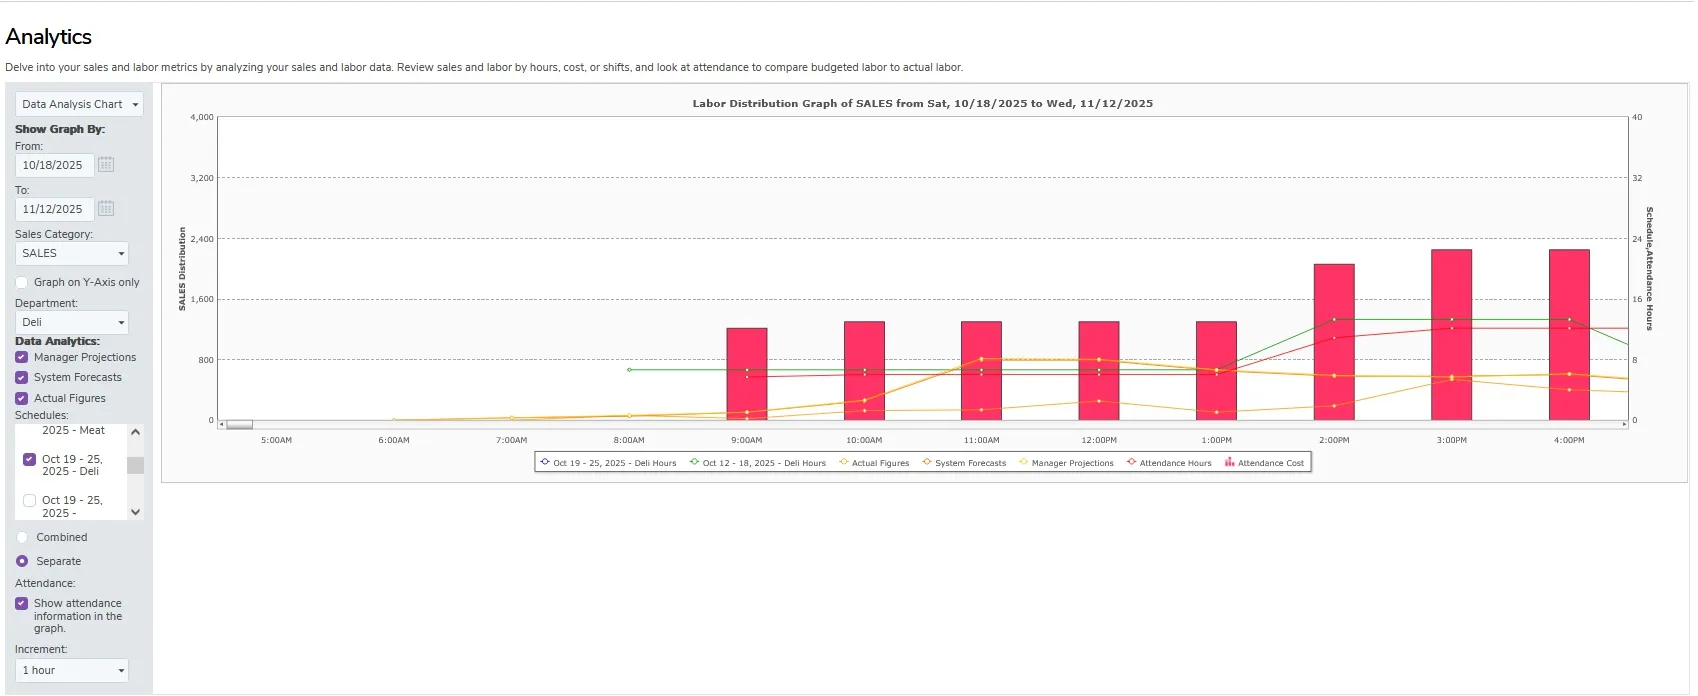
The same graph as above is displayed, but this graph compares the Sales Type with the Scheduled Shifts during the time period, instead of Labor Costs.
Tip: Scheduled Shifts are indicative of the number of unique shifts scheduled during the time period. Just like the Labor Costs, sharply increasing or decreasing lines may indicate a need to change the schedule.
View sales percentages and values simultaneously
You can see see sales percentages and values side by side that display the raw projections, forecasts, or actual sales on the schedule.
Go to app.TimeForge.com and login to your account.
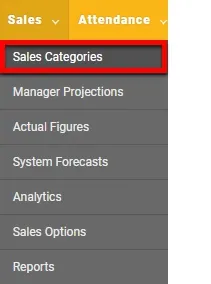
On the Dashboard, find the Sales tab and click on Sales Categories.

Select a Sales Category that you want to see on the schedule and click edit. If you don’t have a Sales Category, you can click Add to create one.
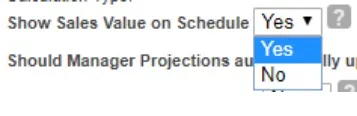
When you are in the setting for a Sales Category, find Show Sales Value on Schedule and select Yes.
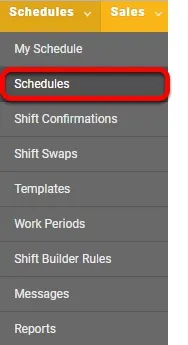
Now find a schedule of your choice. To get to schedules, find the Schedules tab and click on Schedules. Make sure you are in Weekly View.
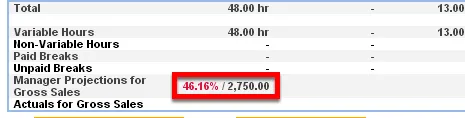
When you see the schedule. This is what the Sales % and Values will look like side by side.
Enforce the Labor to Sales Ratio
The TimeForge sales module is a powerful management tool with the ability to enforce your labor to sales ratio when you create an employee schedule. You are able to choose any sales category that you’ve previously set up to be enforced on the schedule. Furthermore, you can create as many sales categories as your business needs, and use TimeForge to make accurate sales forecasts so that you always know how much labor you have to work with.
Your labor to sales ratio provides you with a benchmark for how much profit your business is making. TimeForge can track your labor to sales ratio for convenient analysis. According to your settings and preferences, TimeForge can also TimeForge can alert you when your schedule costs exceed your schedule threshold (when a schedule is costing you more than you predicted).
Here’s how you can enforce the labor to sales ratio on your employee schedule.
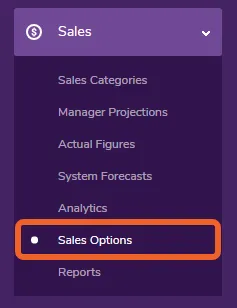
From the Location level, open the Sales tab and select Sales Options.
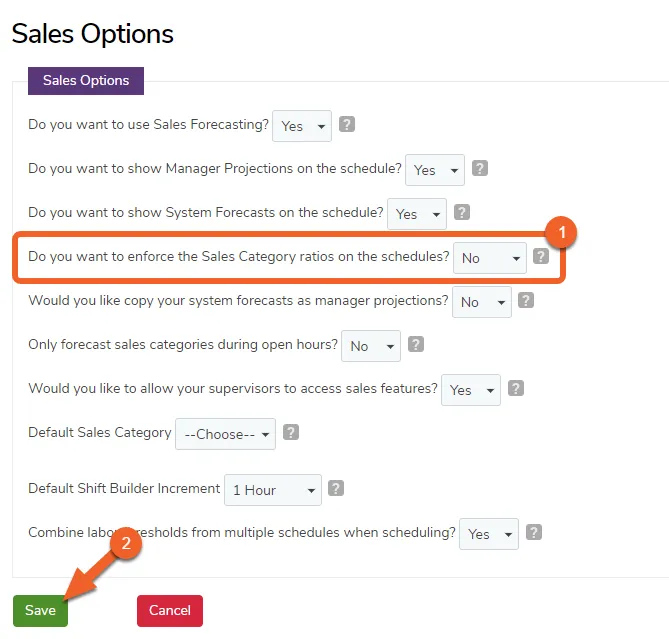
On the Sales Options page, look for the question that says “Do you want to enforce the Sales Category ratios on the schedule?”
- Click on the drop down menu, and select either “Weekly” for the ratio to be based on your weekly sales, or “Daily” to use the daily percentages of your weekly sales*.*
- Click Save when done.
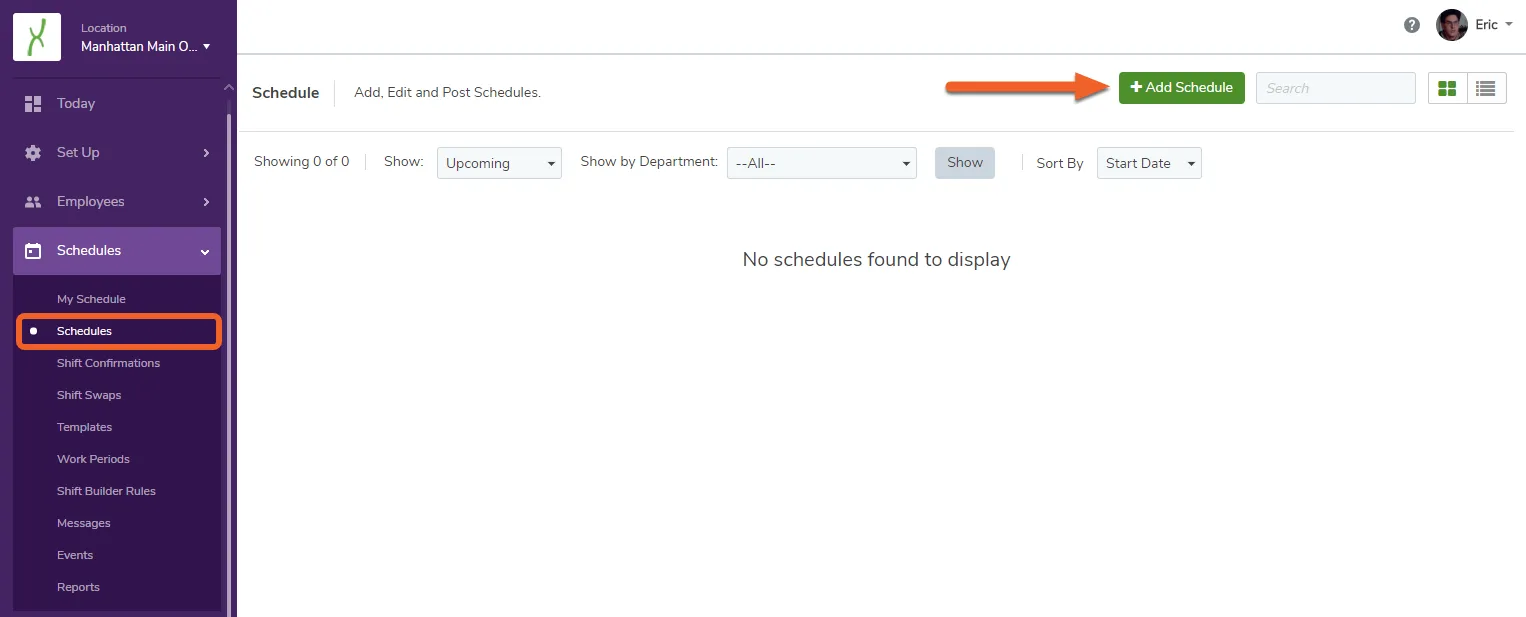
To enforce the ratio, you’ll need a schedule. Create a new schedule by opening the Schedules tab, selecting Schedules, and clicking the + Add Schedule button in the upper right.
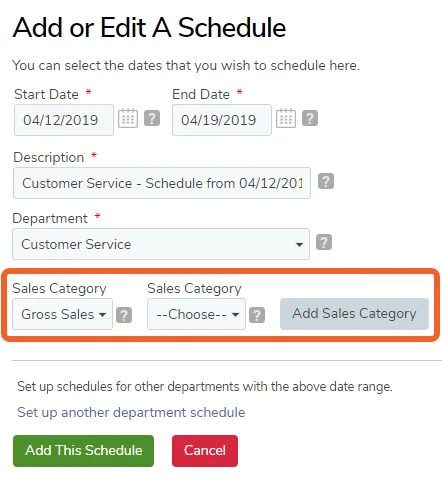
Create your schedule as you normally would, and choose an appropriate sales category to enforce on the schedule. You can choose up to 5 different sales categories.
Here’s an example with one Sales Category added already:
From here, you’ll continue making your schedule as you normally would. If your schedule exceeds your sales category ratio, you will receive a warning (shown below). Additionally, the AutoScheduler won’t be able to schedule a shift that would conflict with the sales category ratio.
If you attempt to make a schedule that would be understaffed, or overstaffed, based on your system forecasts, a warning similar to the one above will appear. Click “OK” to continue scheduling anyway, or click “Cancel” to try something else.

Enter your Sales Thresholds
You may want to enter sales thresholds so that you can better analyze the profitability of your business. Sales Categories offer the ability to monitor your business operations in a quantifiable way. By paying attention to the measurable aspects of your business, you can streamline your operations and prevent surprises to your budget from sneaking up on you, especially with labor costs and accurate scheduling practices. The way you decide to use Sales Categories is up to you, as there are many options to experiment with.
For example, Joe, a grocery store manager, might want to monitor the number of items processed per minute at his store’s registers. Like all managers, Joe does not want to have more employees on hand than are required for the amount of work to be done, so he wants to compare the number of items processed per minute to the number of cashiers working. Each cashier can process 100 items per minute. If the store is processing 1,000 items per minute, Joe needs 10 cashiers on hand to keep up with the amount of work to be done. But Joe only has 8 cashiers on hand! Should he call someone to come in to work? Well, if Joe has set his Sales Threshold appropriately to ten percent (1 employee is 10% of 10 items per minute), TimeForge will notify him that he is short-handed.
For example, by comparing Gross Sales to Labor Costs, you can have a benchmark to understand how well your business ran during a certain period of time. An optimal ratio of Gross Sales to Labor costs for your business might be 10, like Joe’s.
Here’s how to enter a desired threshold to a sales category.
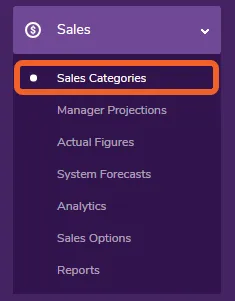
At the Location level, open the Sales tab and select Sales Categories.
Select a Sales Category from those available. If you need to create a new category first, and you have more than one Location, you’ll need to go to the Corporate level to do so.
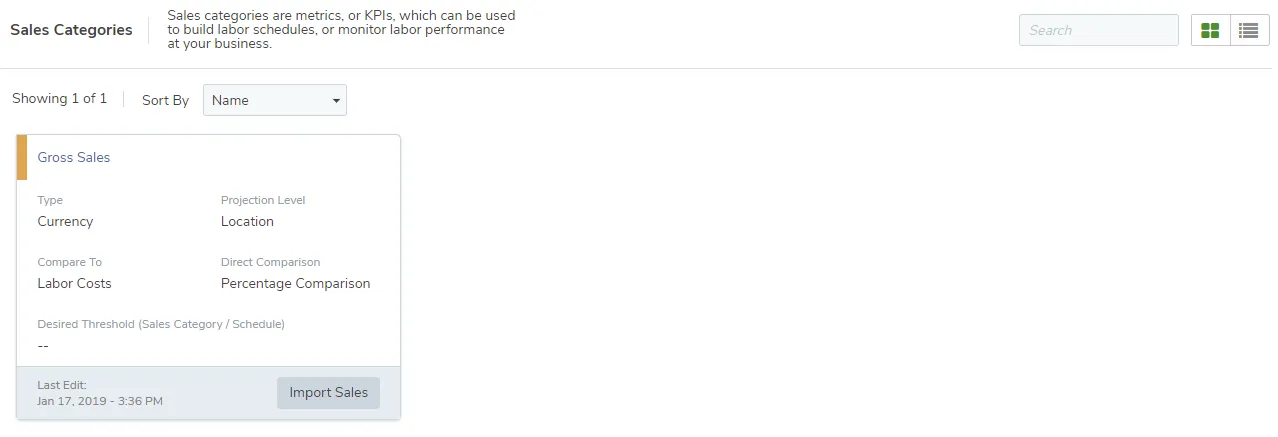
Enter your desired Sales Threshold in the appropriate field.
Enter your Actual Sales values
You may want to enter Actual Sales values to more accurately track sales figures for your business, which can help you predict future sales. Actual Sales figures can be analyzed and viewed in your TimeForge Reports. The ability to predict future sales enables you to build more profit-optimal schedules by estimating the amount of business you will encounter during a certain time period, reducing the likelihood of over staffing or under staffing.
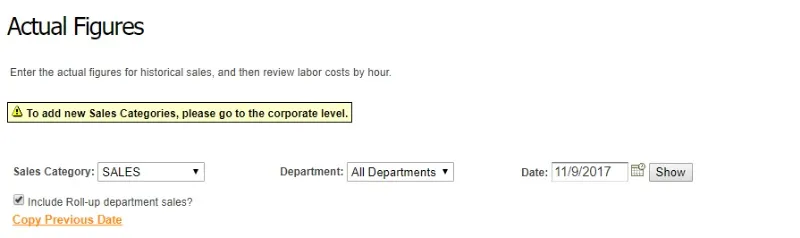
To view the Actual Figures chart, select the sales type, the department, and the date. Actual Figures do not show weeks in the future, only the past and present weeks.
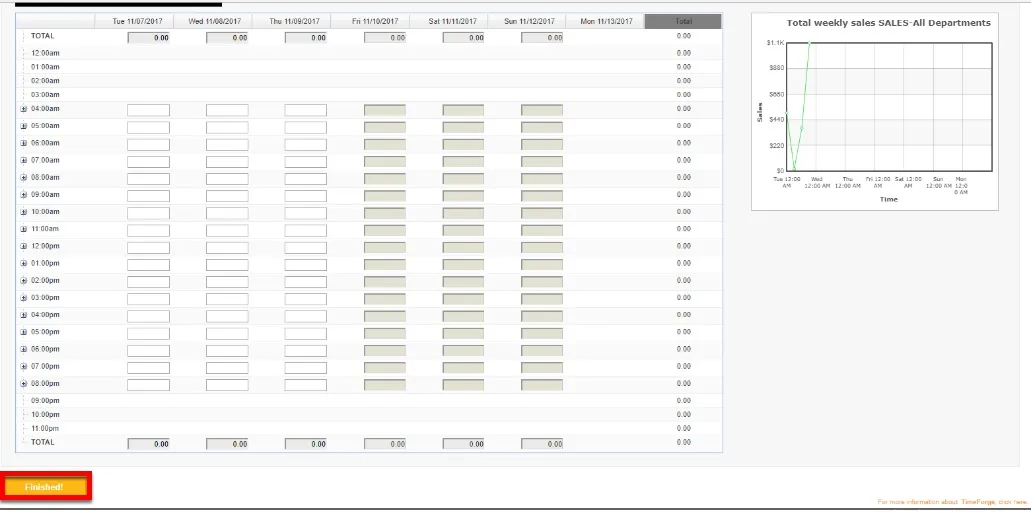
Insert the Actual Sales Values and remember to click the Finished button after completing work.
Forecast sales using weighted average variance
Forecasting your sales using a Weighted Average Variance is similar to calculating with Weighted Averages, except this formula actually lets you eliminate random outliers from being included in the calculations. TimeForge offers a very customizable Sales feature, and this lesson is designed to help you navigate through setting up a weighted average variance forecasting configuration painlessly. After configuring Sales Categories, you’ll likely want to consider setting up ShiftBuilder Rules so you can start generating schedules with the ShiftBuilder based on your Sales Projections.
Of course, if you need any further assistance, please don’t hesitate to contact us.
Forecasting your sales using a Weighted Average Variance can help to eliminate random outliers from being included in the calculations. It’s what happens when you’re calculating a grade for a class, but the teacher lets you drop your lowest grade, but only if it’s 30 points lower than the average of your other grades.
The following is an explanation of each setting under the “Weighted Average Variance” category.
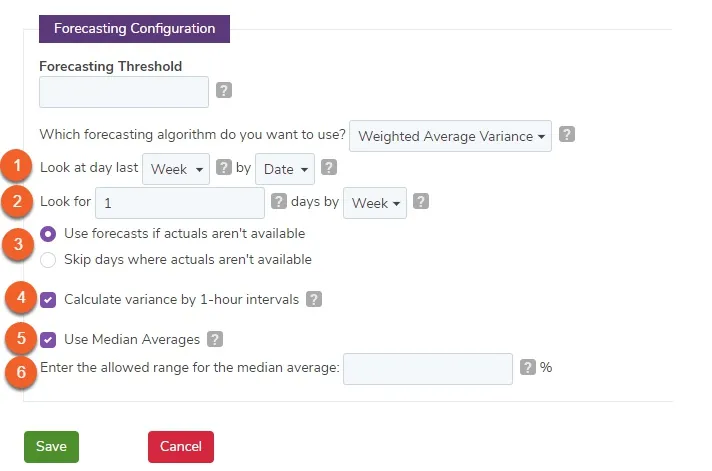

Should the algorithm pay attention to a day from last week, from last month, or from last year? Select whichever option is the best indicator for sales.
Should the algorithm search by date or by day? For example, If it’s forecasting for June 2, 2013, should it look at June 2, 2012 (date) or the first Sunday in June in 2012 (day).

Enter into this field the number of days that the alogorithm should consider. Additionally, select whether the algorithm should look for these days by day or by week. In the example above, we’re considering 8 weeks in the future and 8 weeks prior to today to find the forecasted number. (It would be 8 days if “day” was selected)

This option indicates what TimeForge should do if there are no Actual Sales for the algorithm to calculate from. Choose to either use the forecasted sales for that date as the basis for the current forecast, or simply skip that day.

Since our forecasts are based on hourly sales, this option determines if we run the algorithm based on 1-hour intervals or based on 15 minute intervals (if unchecked, we use 15 minute intervals).

This option determines if we use median averages or raw data. If you check this box, the algorithm will use median averages with the percentage in step 6 to exclude any “random” sales data.

How far from the “middle” should we base the forecast on? In the example above, any data above or below 33.3% of the average will be excluded from the forecast calculations.
Import Sales from a CSV
Sometimes, typing sales information into each day or hour of your week can be a tedious process. TimeForge includes a CSV importer to make bulk data entry much easier. Follow these steps to import your sales with a CSV file:
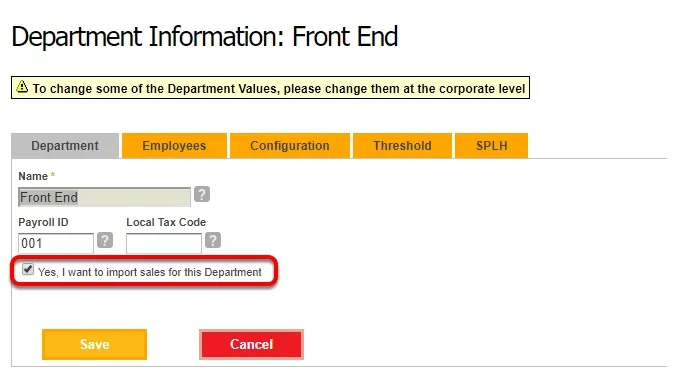
- Log in
- Hover over “Set Up”
- Select “Departments”
- Click “Edit” next to the appropriate Department
- Check the “Yes, I want to import sales for this Department” box
- Click “Save”
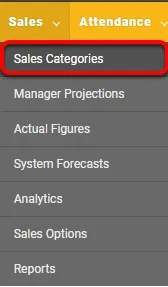
- Hover over “Sales”
- Select “Sales Categories”

Click the “Import Sales” link next to the appropriate category.
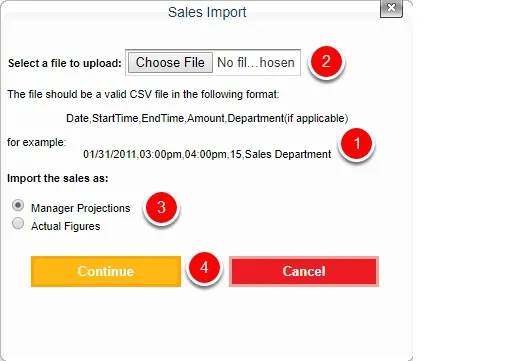
- Make sure your CSV file is formatted properly (see Notes).
- Browse the documents on your computer and select the appropriate file.
- Decide whether you want your sales numbers to be imported as Manager Projections or Actual Figures.
- Click “Continue”.
Notes: You cannot currently import data on top of data that already exists.
Make sure that your number formatting for the Amount column doesn’t include commas (for example, “1234″ instead of “1,234″).
If you are importing data for the whole day, set the start and end times to be the open and close times.
If you are using departments, make sure the names in the CSV match names in TimeForge exactly.
Import Sales Thresholds from a CSV
TimeForge’s sales thresholds are a powerful tool to allow you to budget and monitor your labor costs. Using the sales thresholds, you can set up a target budget based on labor costs, labor hours, or labor shifts.
To easily import the sales threshold information, follow these steps:
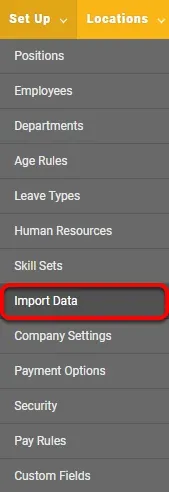
- Log in
- Hover over “Set Up”
- Select “Import Data”
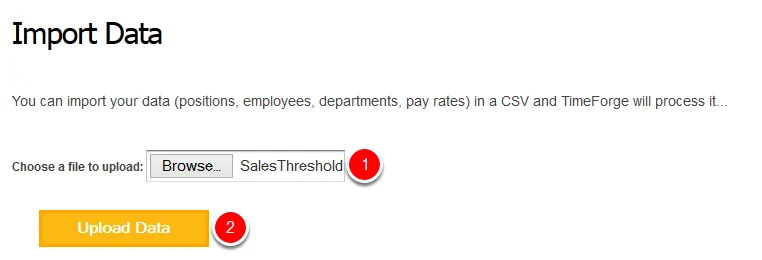
Make sure your CSV file has the necessary information–such as the sales category, position or department, the start date and end date, the threshold, and minimums and maximums.
Note: Each threshold should be on its own line.
- Click “Browse” to find and select the appropriate CSV file.
- Click “Upload Data”.
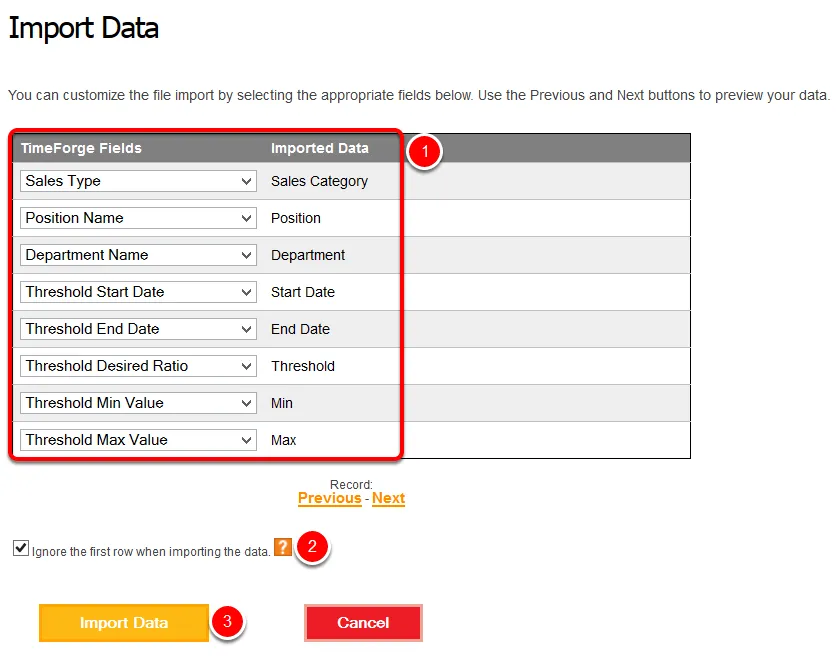
- You can choose to import a number of fields related to Sales thresholds.
- Check the box to ignore the first row when importing the data.
- Click “Import Data”. TimeForge will load your data and show you any warnings or errors when it’s done.
- Sales Type – Enter the sales category, such as Gross Sales.
- Position Name – Enter the TimeForge Position Name. Note: You can use positions or departments, but not both.
- Department Name – Enter the TimeForge Department Name. Note: You can use positions or departments, but not both.
- Threshold Start Date – Enter the date the threshold begins.
- Threshold End Date – Enter the date the threshold ends.
- Threshold Min Value – Enter the minimum value for the threshold.
- Threshold Max Value – Enter the maximum value for the threshold.
Distribute projections throughout the day based on Actual Sales figures
Your sales vary hour-by-hour throughout the day. For example, you may do 50% of your sales between 5 PM and 8 PM. In TimeForge, you can keep track of your actual figures even down to the 15 minute interval to see exactly how these sales vary. You can also copy this varied percentage of your total daily sales when you’re filling out manager projections.
Let’s say you’re projecting $20,000 of sales on Saturday. You can use your historical actual figures to determine the pattern of when you’ll be selling. For example, let’s say every Saturday you do 50% of your sales from 5 PM to 8 PM. After you tell the system to find this pattern, you can simply put your projected $20,000 in for the total sales on Saturday, and the system will distribute those sales based on the pattern. You would then see $10,000 distributed from 5PM to 8PM (or 50%) instead of evenly distributing the sales across all hours of the day.
Here are instructions on how to use this functionality.
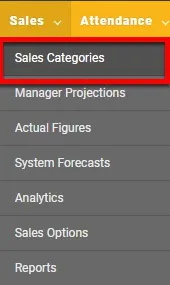
You’ll first need to tell the system which pattern to find. This is done in the “Sales Categories” page.
- Login
- Hover over the “Sales” tab
- Click “Sales Categories”

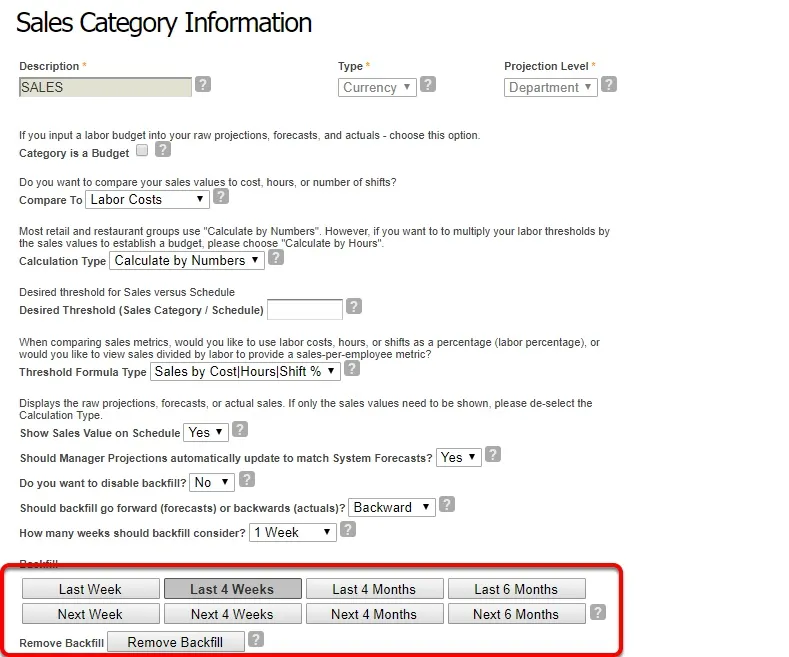
Go to Backfill and select a period to set sales percent calculations for Manager Projections. This will tell the system which information to consider when it is finding a pattern of your daily sales. For example, if you chose “Last 4 weeks”, the system will average each individual day for the past 4 weeks to determine the percentage of daily total sales down to the 15 minute interval.
Note: Before selecting the Backfill period, make sure you have Actual Sales figures for those periods. The manager sales projections percentages are based on your actual sales.
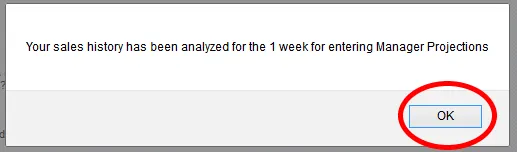
Select “OK” to continue

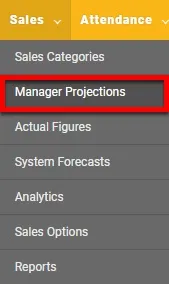
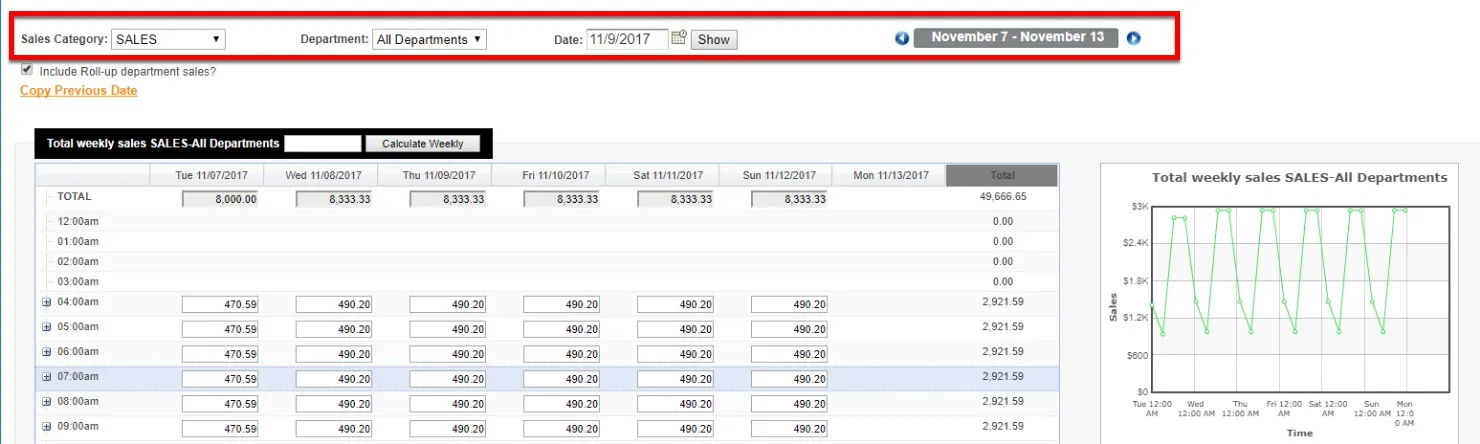
For this method to work, you must use a sales category that has been assigned a backfill because this is how the system works to find a pattern.
Note: You may also select Departments to view a specific department.
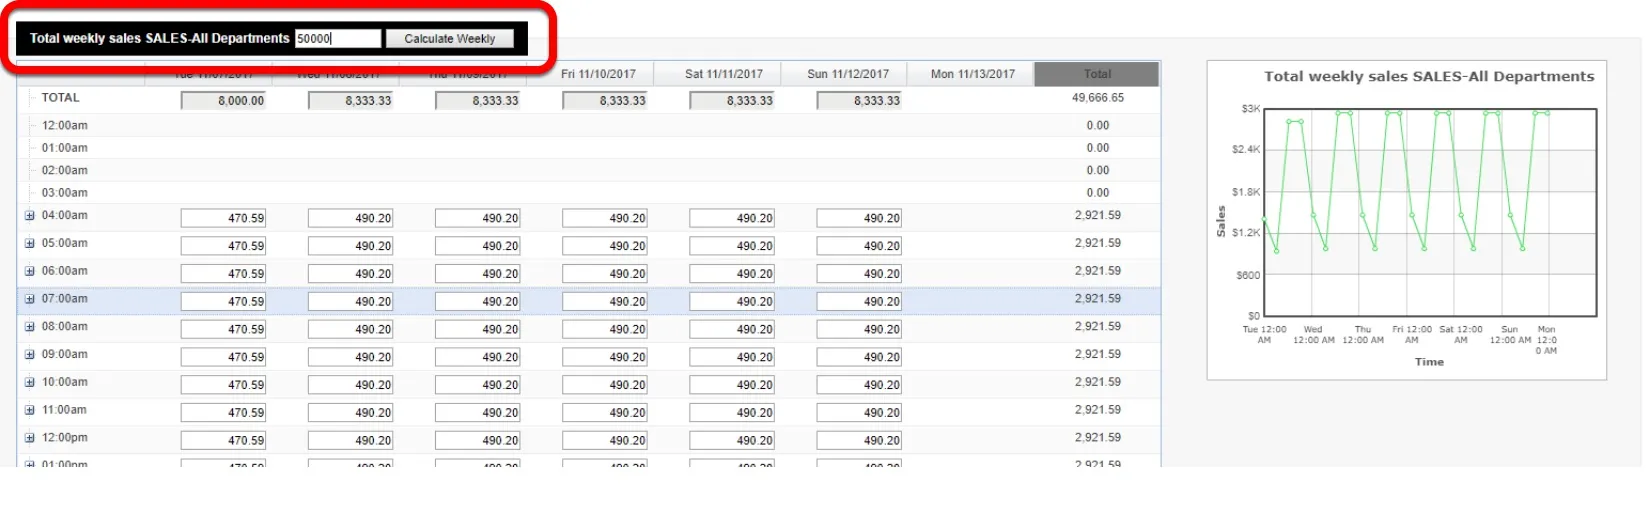
After you enter a value for your total weekly sales, click “Calculate Weekly”. Then, sales projection figures will automatically populate for each day of the week.